The Dashboard
Your command center and where to start each week.
What the Dashboard is
The Dashboard is your home base in Vibe SEO. Once you finish the setup wizard, it becomes the page you land on every time you open Vibe SEO from the WordPress sidebar. Its job is to show you how your site is actually performing in Google search and to point you at the specific pages and keywords worth working on next. It reads live data straight from your Google Search Console property, so the numbers are your real clicks, impressions, and rankings, not estimates.
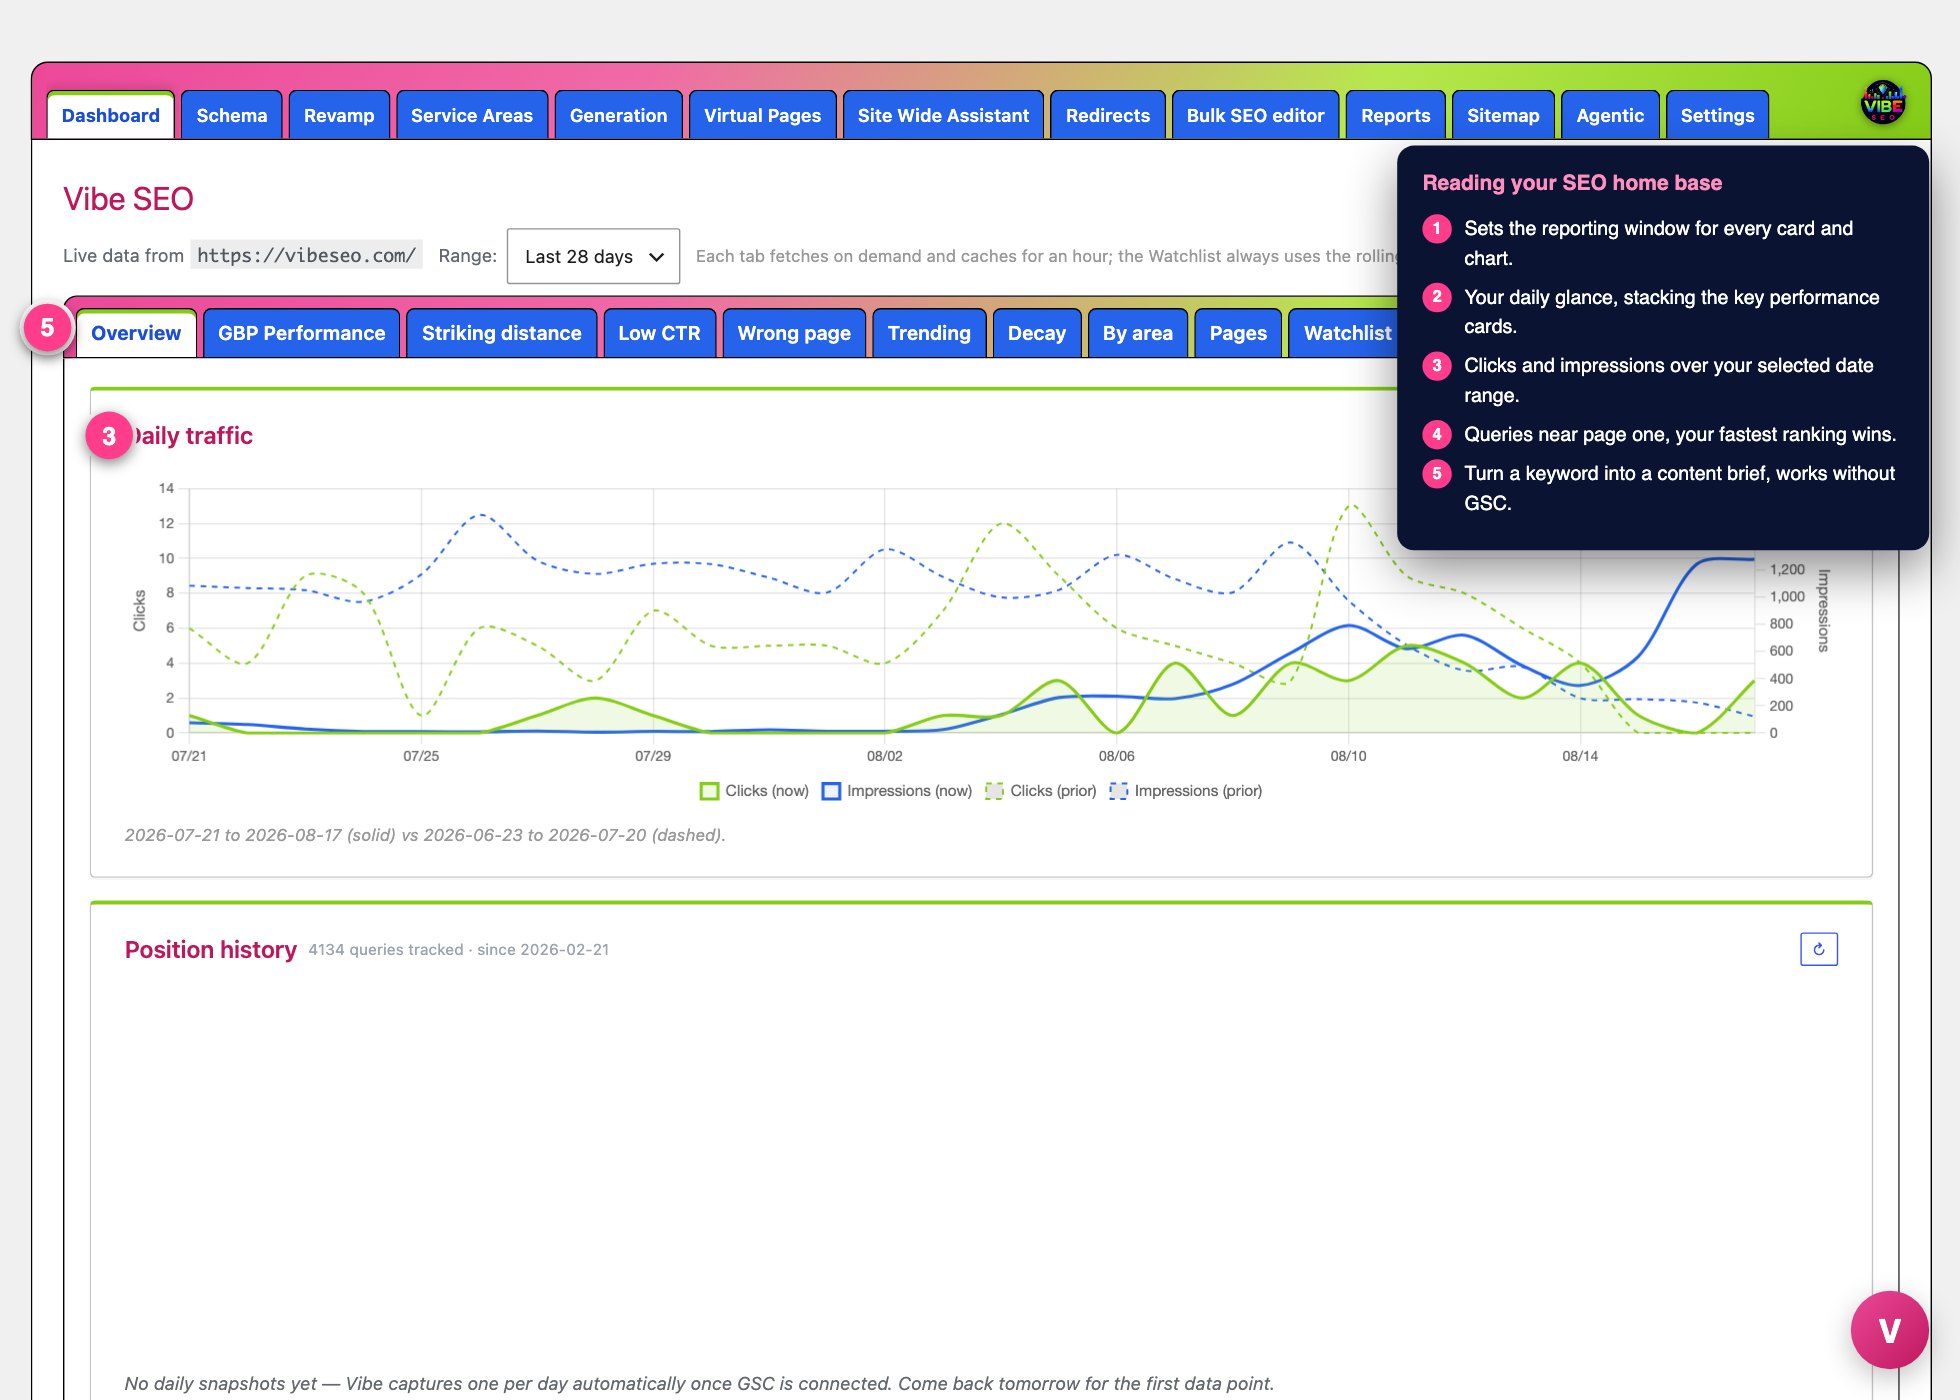 The dashboard screen, with the numbered steps from this lesson marked.
Where to find it
In the WordPress admin sidebar, click Vibe SEO, then Dashboard. The same tab strip runs across the top of every Vibe SEO screen, so you can always get back here in one click. If you have not finished the setup wizard yet, the Dashboard shows a short notice with a link to run it. Finish setup first.
Connect Google Search Console first
The Dashboard's analytics only appear after you connect Google Search Console. Until you do, you will see a card that says GSC data is unavailable, with a button that takes you to Site Settings to connect it. Connecting takes one visit to Site Settings, and the data populates within a few minutes. One tab, Content Creator, works without GSC, so you can start writing even before you connect.
Once connected, a row near the top shows the exact property Vibe is reading and a Range dropdown: Last 7, 28, 90, 180, or 365 days. It defaults to 28 days and remembers your choice in your browser. Each tab loads on demand and caches for about an hour, so if you want the very latest numbers, use the small refresh control on any card.
Reading the Overview
Overview is the first tab and your daily glance. It stacks several cards:
- Daily traffic, a line chart of clicks and impressions for the selected range against the prior period.
- Position history, built from a daily snapshot Vibe captures automatically, with a line per watchlisted keyword plus an average baseline. The vertical axis is flipped so an improving rank reads as an upward line.
- Position distribution and Click share, showing where your rankings sit and which queries earn the most clicks.
- Topline, the headline numbers for Clicks, Impressions, CTR, and Average position, each with a small trend line and a change versus the prior period. Green is good, red is not.
- Quick summary cards for Striking distance, Low CTR pages, Watchlist, and Trending gainers, each with a link to the full report.
The action tabs
The remaining tabs turn data into a to-do list. Striking distance lists queries ranking between positions 5 and 20 with at least 25 impressions, the ones where a small push often moves you onto page one. Low CTR flags pages that get impressions but few clicks, which usually means the title tag and meta description need a rewrite. Wrong page finds searches where your homepage is grabbing clicks that a specific landing page should own, and suggests the better page. Trending shows your biggest gainers and decliners. Decay surfaces pages whose traffic has fallen off so you can refresh them. By area filters queries to the cities in your saved service areas. Pages ranks your top 100 landing pages by clicks.
The Watchlist
The Watchlist is where you track keywords that matter to you. Type a keyword and click Add to watchlist, or click one of the suggested keyword chips pulled from your own Search Console data. You can track up to 50, and Vibe keeps a 90-day history of position, clicks, and impressions for each. It also raises alerts when a tracked keyword drops several positions or falls off page one, and those alerts surface on the Overview so you notice them early.
Content Creator
The last tab is Content Creator, and it works with or without GSC. Give it a target keyword and an optional angle, and it returns a structured brief with the intent, H1, outline, FAQs, and internal link picks. If GSC is connected, you can also check real questions people are searching and have the draft answer them. From there, one click turns the brief into a draft blog post, a new page, or a copy-and-paste content block.
Pro tips and common mistakes
Connect Search Console before you judge the tool. An empty Dashboard almost always means GSC is not connected, not that nothing is happening. Position history starts blank and fills in one day at a time, so check back tomorrow for the first data point. Match the Range to your question, using 7 or 28 days for recent moves and 90 or more for real trends. Work Striking distance and Low CTR first, since they are the fastest wins. And remember the Watchlist window is always 90 days, so the Range dropdown does not change it.